| |
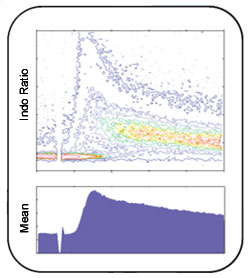
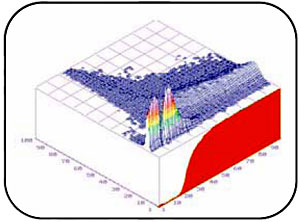
| MultiTime provides research laboratories with the ability to display flow cytometry data as a function of time. This makes it ideally suited for the kinetic analysis of calcium flux, pH changes, membrane potential changes or other cellular parameters. Data can be displayed as histograms, dot plots, contour plots, 3-D isometric plots or 3-D stacked contour plots. MultiTime normalizes data to eliminate variation in cell numbers per unit time. Multi-parameter listmode is possible, as is the ratioing of any two of the listmode parameters. Curve subtraction allows the display of just responding cells vs. time, if desired. The maximum response level and percent responding cells are calculated, printed and stored to a database. |
 |
 |
|
|
|